StocknearRating 2026: Our Score & Breakdown
Last tested 2026-03-27 · Last updated 2026-03-27
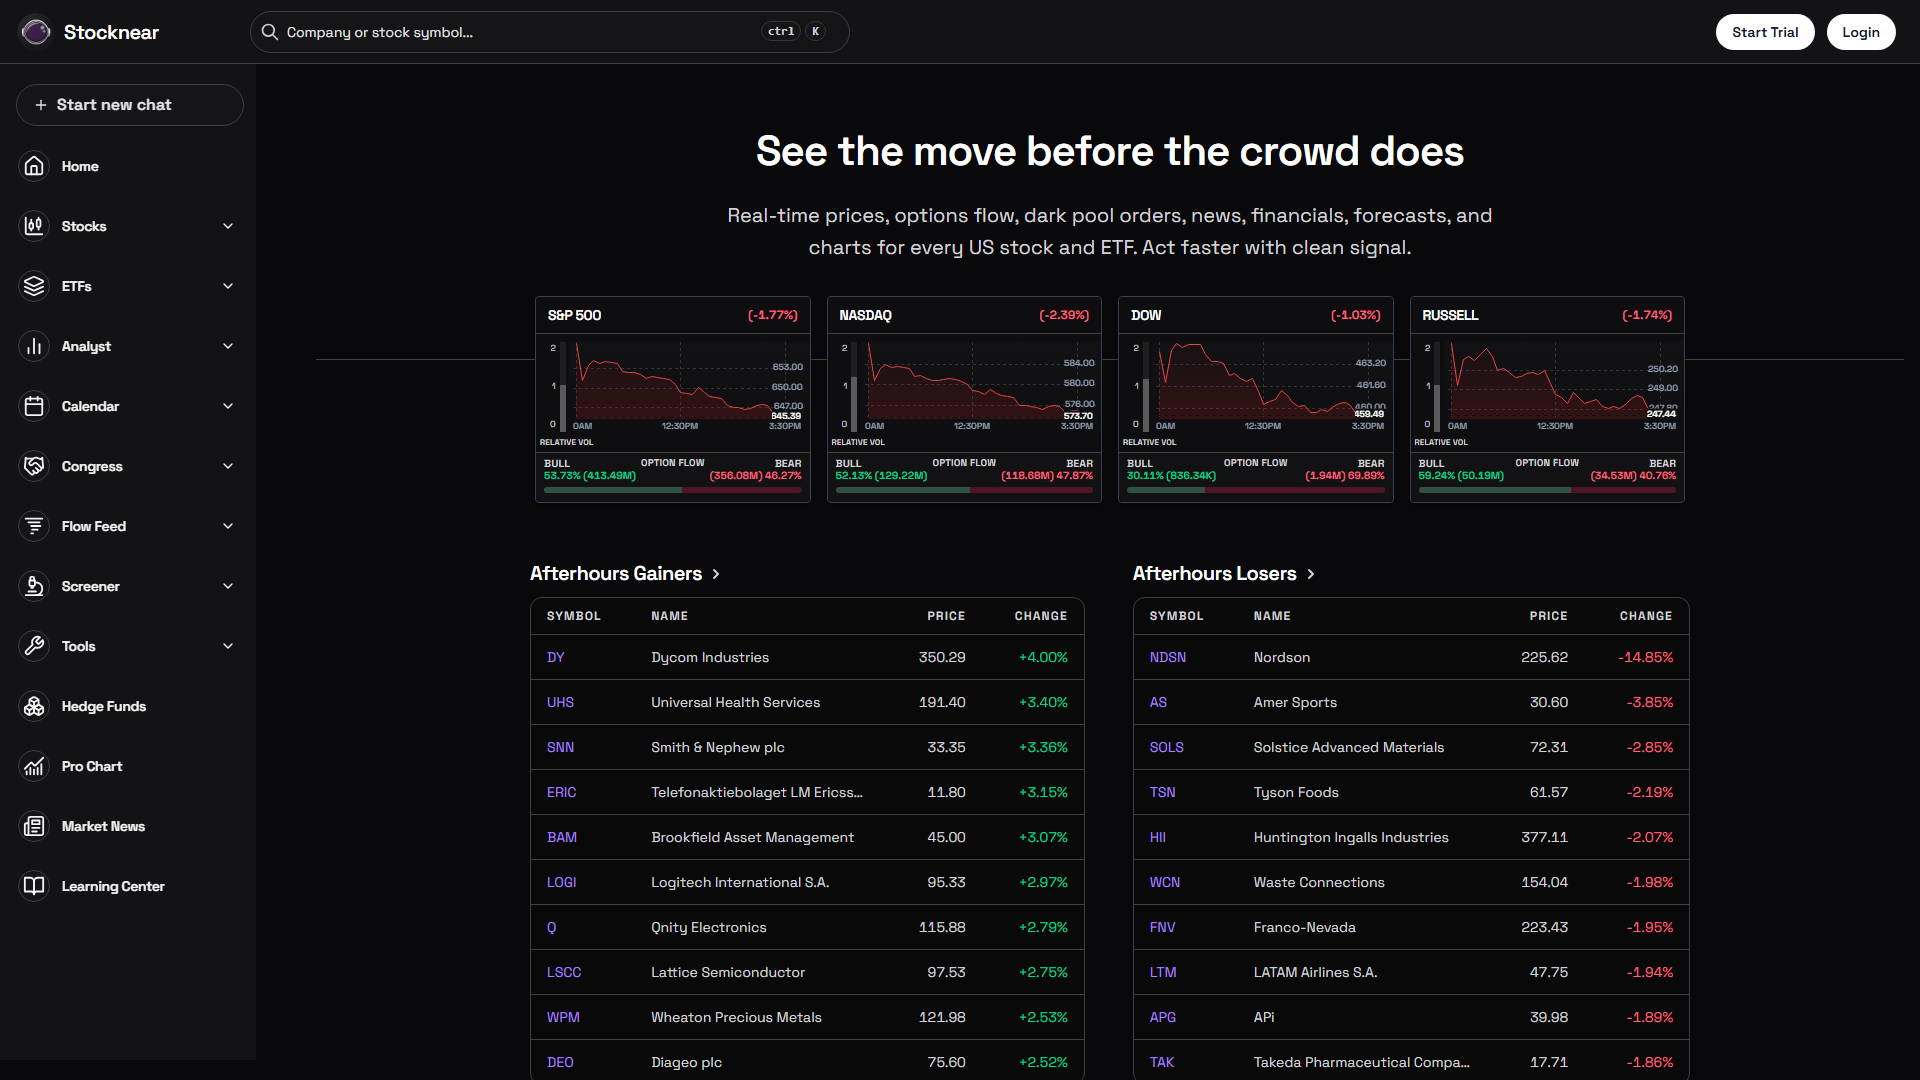
Stocknear
7.0
Overall Score
Based on hands-on testing across 5 categories. Scale: 1–10.
SCORE BREAKDOWN
Accuracy6.8
Ease of Use7.5
Features7.5
Value8.5
Support6.5
How we score: Accuracy (25%) and Features (25%) carry the most weight, followed by Ease of Use (20%) and Value for Money (20%). Customer Support accounts for 10%. All scores reflect our latest hands-on testing.
HOW STOCKNEAR COMPARES
| Category | Stocknear | Category Avg | Diff |
|---|---|---|---|
| Overall | 7.0 | 7.2 | -0.2 |
| Accuracy | 6.8 | 7.0 | -0.2 |
| Ease of Use | 7.5 | 7.5 | +0.0 |
| Features | 7.5 | 7.4 | +0.1 |
| Value | 8.5 | 7.1 | +1.4 |
| Support | 6.5 | 6.5 | -0.0 |
FAQ
Is Stocknear free?›
Stocknear offers a free Basic tier with limited access. Paid plans start at $10/month with a 7-day free trial.
What is the Congress trading dashboard?›
Stocknear tracks stock trades made by U.S. Congress members, letting you see what politicians are buying and selling.