TipRanksRating 2026: Our Score & Breakdown
Last tested 2026-03-15 · Last updated 2026-03-26
TipRanks
8.4
Overall Score
Based on hands-on testing across 5 categories. Scale: 1–10.
SCORE BREAKDOWN
Accuracy8.5
Ease of Use8.5
Features8.5
Value8.0
Support8.0
How we score: Accuracy (25%) and Features (25%) carry the most weight, followed by Ease of Use (20%) and Value for Money (20%). Customer Support accounts for 10%. All scores reflect our latest hands-on testing.
HOW TIPRANKS COMPARES
| Category | TipRanks | Category Avg | Diff |
|---|---|---|---|
| Overall | 8.4 | 7.2 | +1.2 |
| Accuracy | 8.5 | 7.0 | +1.5 |
| Ease of Use | 8.5 | 7.5 | +1.0 |
| Features | 8.5 | 7.4 | +1.1 |
| Value | 8.0 | 7.1 | +0.9 |
| Support | 8.0 | 6.5 | +1.5 |
FAQ
What is the TipRanks Smart Score?›
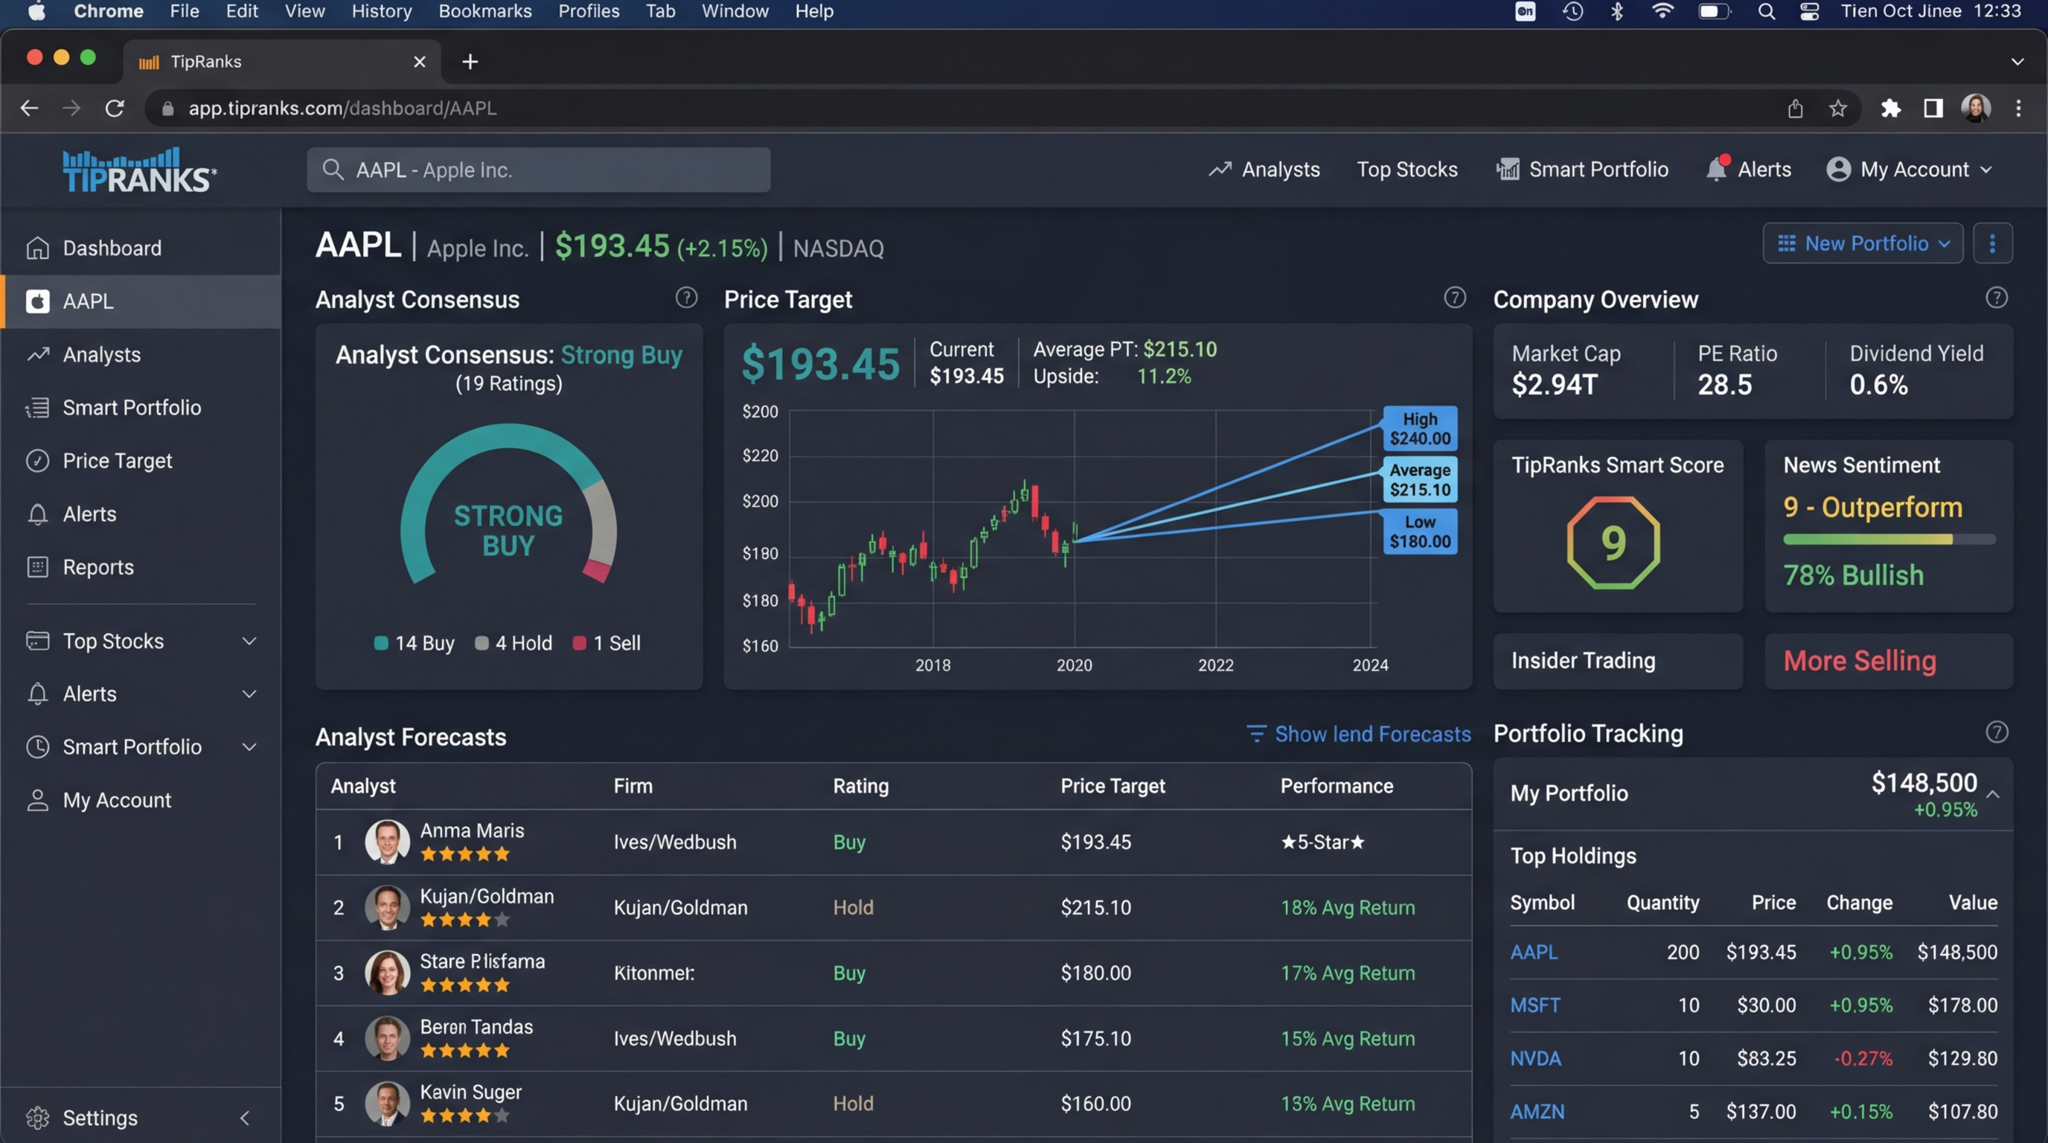
The Smart Score is a proprietary AI-driven rating system that evaluates stocks from 1 to 10 based on eight market factors, including analyst consensus, insider trading activity, hedge fund sentiment, and technical indicators.
Is TipRanks free to use?›
Yes, TipRanks offers a generous free tier with access to basic Smart Scores, analyst consensus ratings, and limited research. The Premium plan at $29.95/month unlocks full analyst performance data, AI Analyst Reports, and advanced portfolio tools.
How accurate is TipRanks?›
TipRanks' value lies in its analyst ranking system, which has shown that top-rated analysts on the platform significantly outperform lower-rated ones. However, the Smart Score itself is a screening tool rather than a guaranteed predictor of performance.